
It’s often much easier to convey information with a well-designed diagram than to communicate through a large text blurb. As the old saying goes, “a picture is worth a thousand words.”
That’s where Microsoft Visio comes in. Part of the Microsoft 365 suite, this app helps professionals convey information through professionally designed diagrams.
What is Microsoft Visio?
Microsoft Visio is the diagramming and vector graphics application in the Microsoft Office family. If you need to make diagrams such as decision trees, flow charts, org charts, and so on, this is the Microsoft tool to do it. Visio is less popular than other Microsoft apps like Word or Excel, but it is still a valuable tool to understand and use in everyday business.
Although there is a desktop Visio application, this cheat sheet will walk you through the basics of using Visio in Microsoft 365 — the web-only version that’s included with Microsoft 365/Office 365 business and enterprise subscriptions — since most business professionals who use Office have access to this version. All of the features in the web version of Visio can also be found in the desktop application, but not vice versa.
How to find Microsoft Visio within Microsoft 365
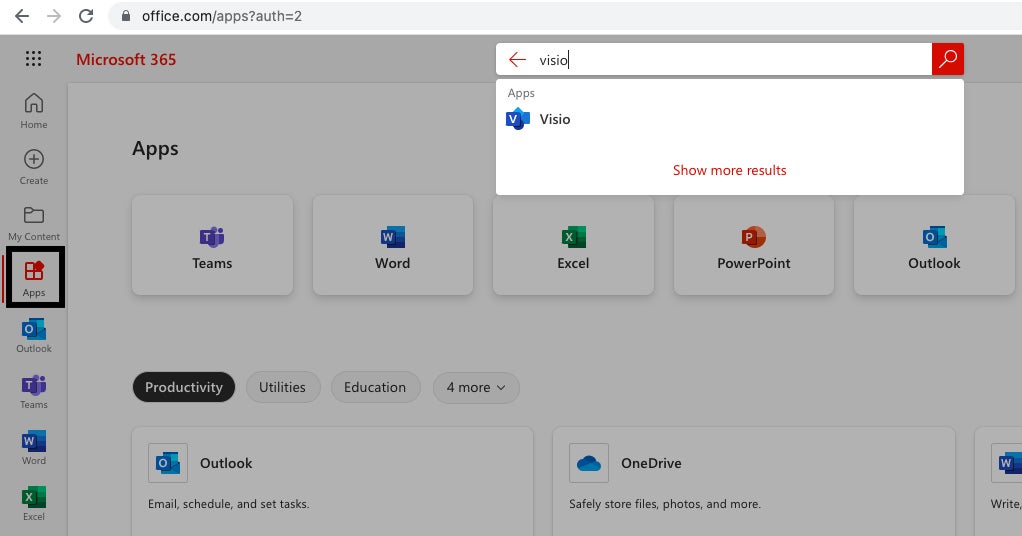
To begin this tutorial, we need to locate and open Microsoft Visio. For most people, Visio will not be a default application on your Microsoft 365 home page (formerly known as the Office home page). To find Visio, navigate your Microsoft 365 home page, sign in if you haven’t already, and type visio in the search bar at the top of the screen.
 Shimon Brathwaite/IDG
From the Microsoft 365 home page, search for Visio and launch it in your browser. (Click image to enlarge it.)
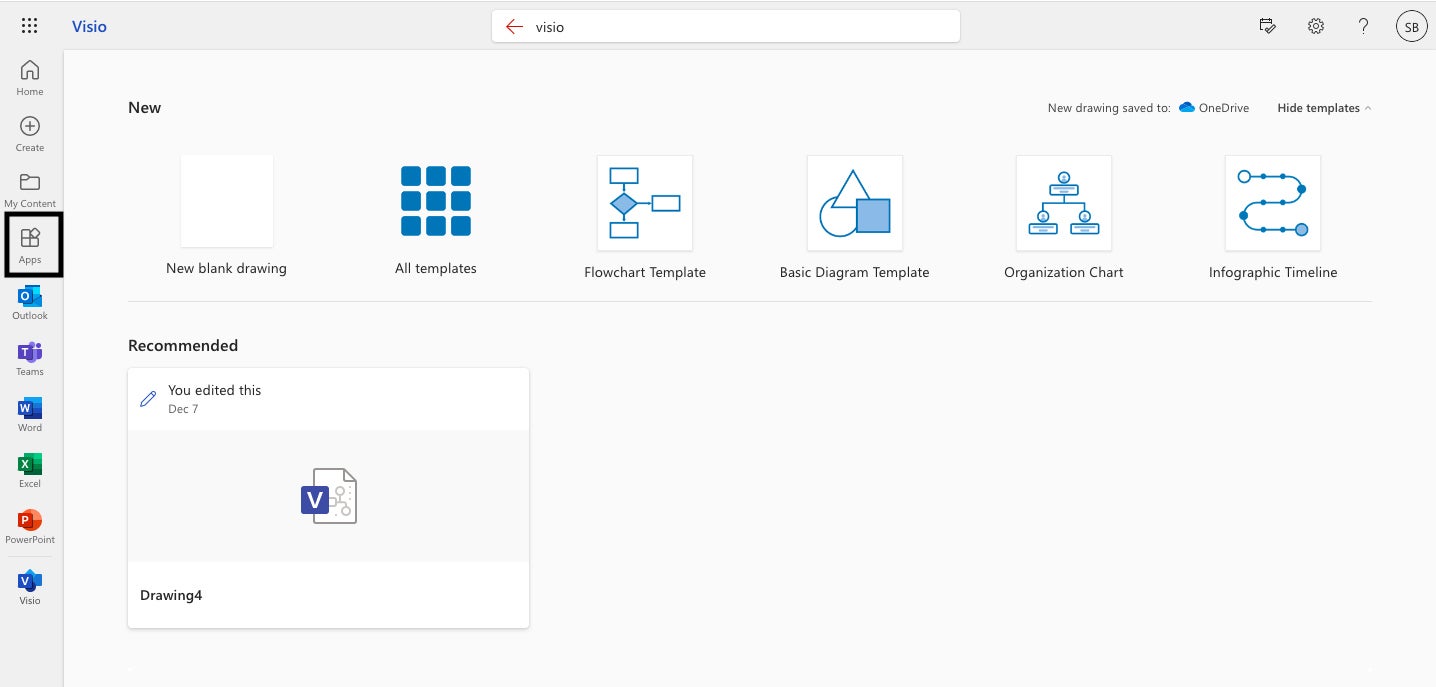
Click Visio in the results list to launch the web app in your browser. You will be taken to a page where you can see some commonly used templates for creating diagrams. This includes flowcharts, basic diagrams, organizational charts, and infographic timelines. There is also an icon labelled “All templates” — here you can go through the complete list of templates available in Visio to help you find the exact template that is right for your situation.
 Shimon Brathwaite/IDG
The Visio start page has a variety of templates to start from. (Click image to enlarge it.)
Using templates is the easiest way to begin making diagrams in Visio. I’ll walk you through two of the most common Microsoft Visio use cases — creating flowcharts and org charts. If Visio doesn’t have a template that suits your business needs, it’s quick and easy to make custom diagrams using Visio’s drag-and-drop features; I’ll show you that process as well.
How to create a flowchart in Microsoft Visio
A flowchart is a type of diagram that represents a workflow or process. It is excellent for showing the step-by-step process for completing a task while giving you the flexibility to show different decisions that need to be made and representing if-then scenarios. Microsoft Visio makes it extremely easy to create this type of diagram.
In this example, we will create a simple flow diagram to show what will happen during a team meeting to discuss a new idea for a company app. The team will discuss the idea, decide if they like it, and then take action based on that decision before ending the meeting.
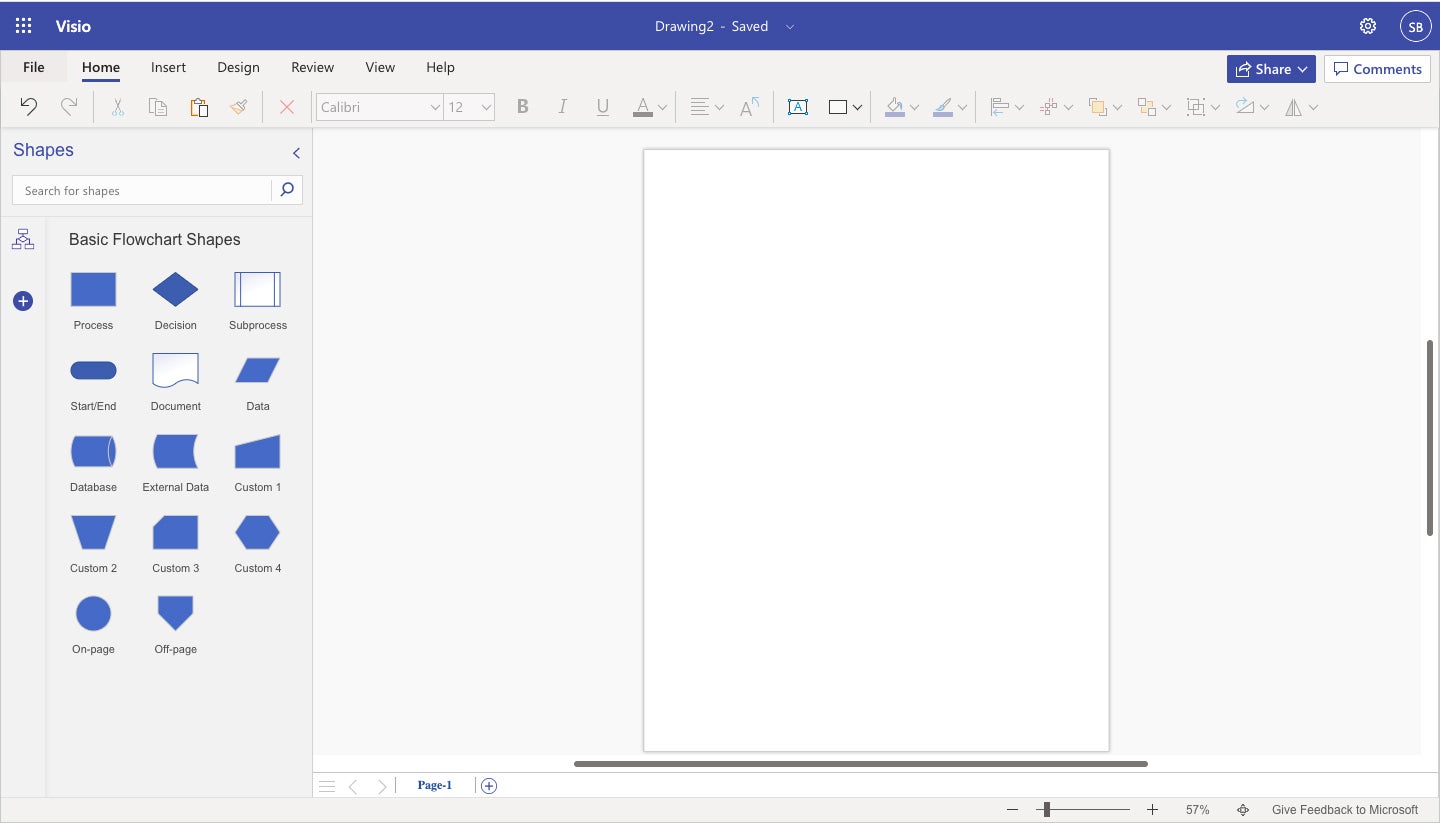
Begin by clicking the Flowchart Template icon on the Visio start page. You’ll be taken to the main Visio interface, which looks a lot like Microsoft Word and other Microsoft 365 apps.
 Shimon Brathwaite/IDG
The flowchart template opens with basic flowchart shapes in the left column and a blank canvas on the right, topped by the Office Ribbon toolbar. (Click image to enlarge it.)
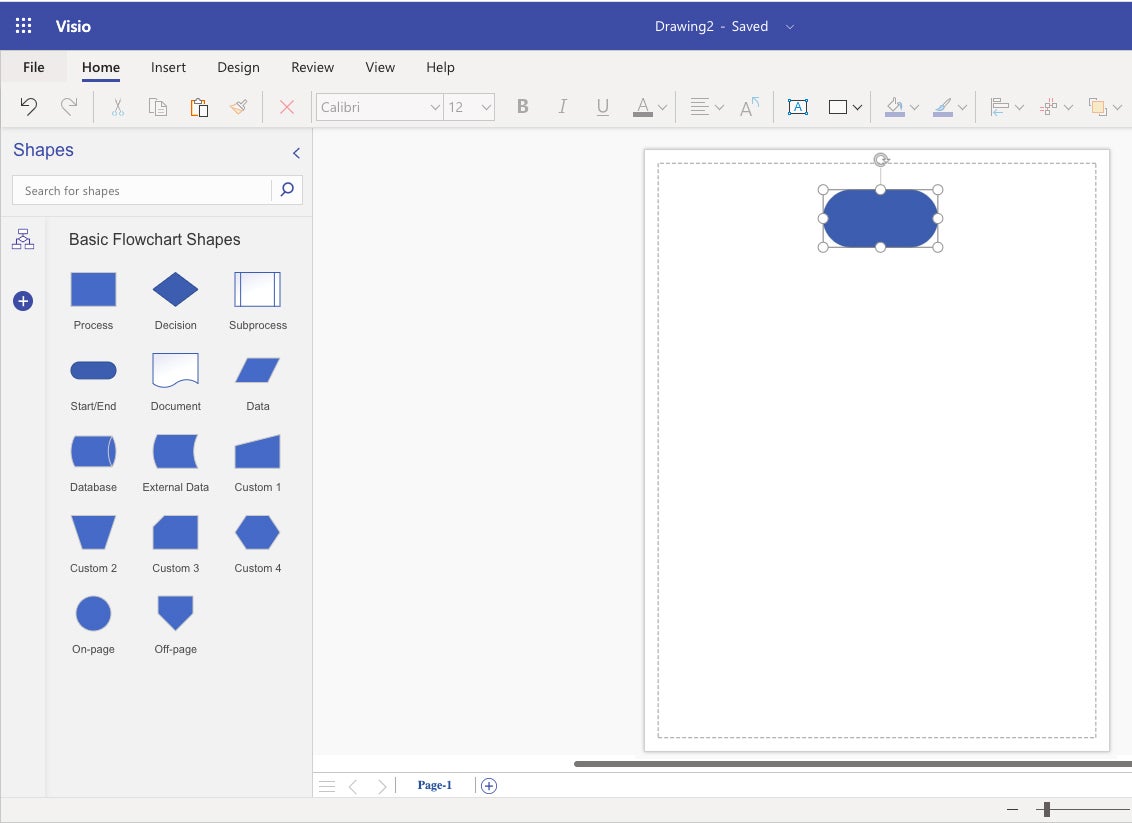
The first step for any flowchart is creating a start point. Click and hold the oval Start/End icon in the left panel and drag it onto the blank canvas area on the right. The oval object appears with eight “handle” points at the corners and sides. To resize the oval, click and drag any of these handles; to move the oval on the canvas, click the middle of the oval and drag it.
 Shimon Brathwaite/IDG
Drag a Start/End oval onto the canvas. Drag any of the “handles” around the outside of the oval to resize it. (Click image to enlarge it.)
To add text to an image, click in the center of it, and you’ll enter text edit mode — just type in the text you want to appear there. In our example, we’ll call the starting oval shape “Team Meeting Begins.” You can adjust the text’s font and size using the tools in the Ribbon toolbar at the top of the screen.
 Shimon Brathwaite/IDG
The start oval now shows “Team Meeting Begins.” (Click image to enlarge it.)
Next, you need to add your processes — every step that will be taken for the task to be completed that doesn’t require a decision to be made. These are represented by rectangles.
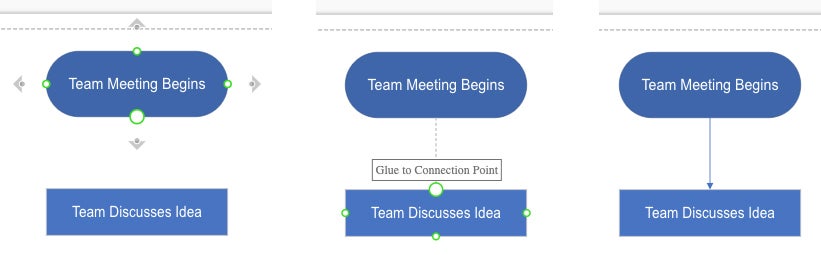
Click the Process icon and drag it to the canvas below the oval we added previously. As you do so, a dotted green line appears that guides you to place the rectangle directly below the oval. Resize the rectangle as needed, then name it “Team Discusses Idea.”
To connect the items, simply hover over the bottom edge of the start image, then click and drag from the green and white button on the start image to the top of the process image. This will create a downward-flowing arrow connecting the two.
 Shimon Brathwaite/IDG
Connecting the process rectangle to the start oval. (Click image to enlarge it.)
If you make a mistake, you can delete any shape or line on the canvas by right clicking-it and selecting Delete from the pop-up menu.
Next, in our flowchart, we’ll show that the team needs to decide whether they like the app idea. This is represented via a diamond image and will have three possible outcomes.
Click the Decision icon in the left panel, drag it below “Team Discusses Idea,” and repeat the steps outlined above to resize it, name it, and connect it as shown below.
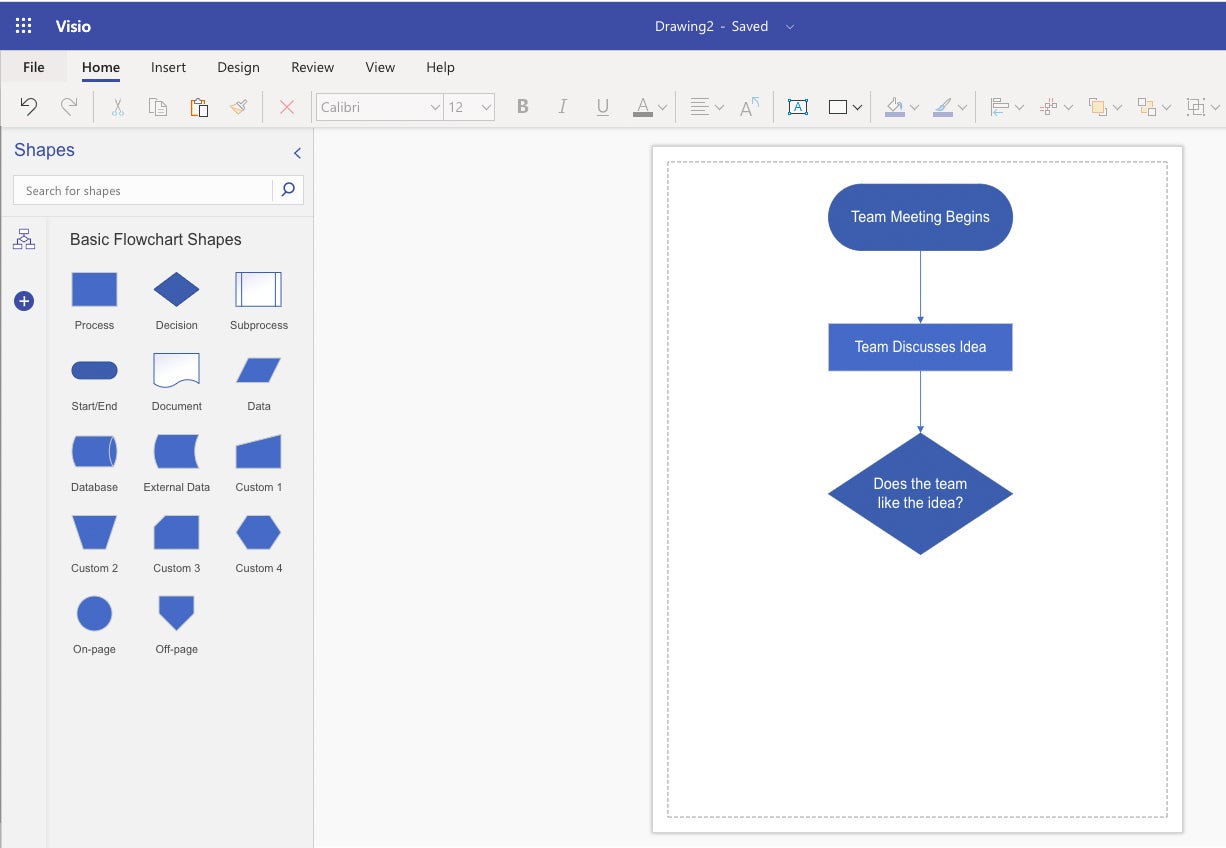 Shimon Brathwaite/IDG
Add the decision diamond and connect it to the process rectangle above. (Click image to enlarge it.)
The three possible responses to the decision will be “No,” “Yes,” and “Not Enough Info.”
To add text boxes for the responses, go to the Home tab on the Ribbon and select the Text Box icon (a square with an A in the middle). Click on that and your cursor will be able to draw text boxes on the canvas. Create a text box for each response, then type the appropriate word or phrase in each one. You can work with text boxes in the same ways you can with shapes.
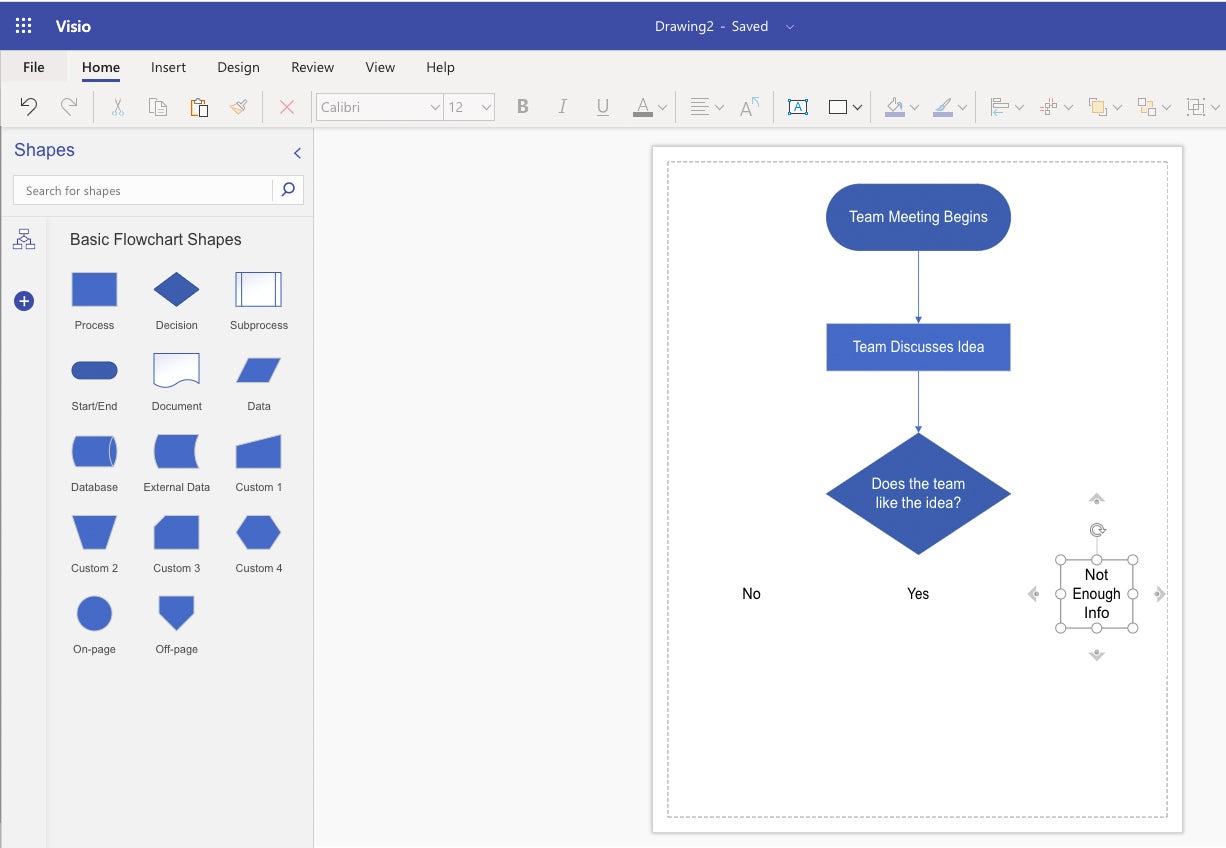 Shimon Brathwaite/IDG
Adding text boxes for the three possible responses. (Click image to enlarge it.)
Below each text box, add a rectangular Process shape for its outcome and name the outcome shapes as shown below. Draw connector lines from the Decision shape to each response and from each response to its outcome. To create connector lines that go across and then down the canvas, simply drag from the starting object out to the side and then down, and the connector line will appear where you dragged.
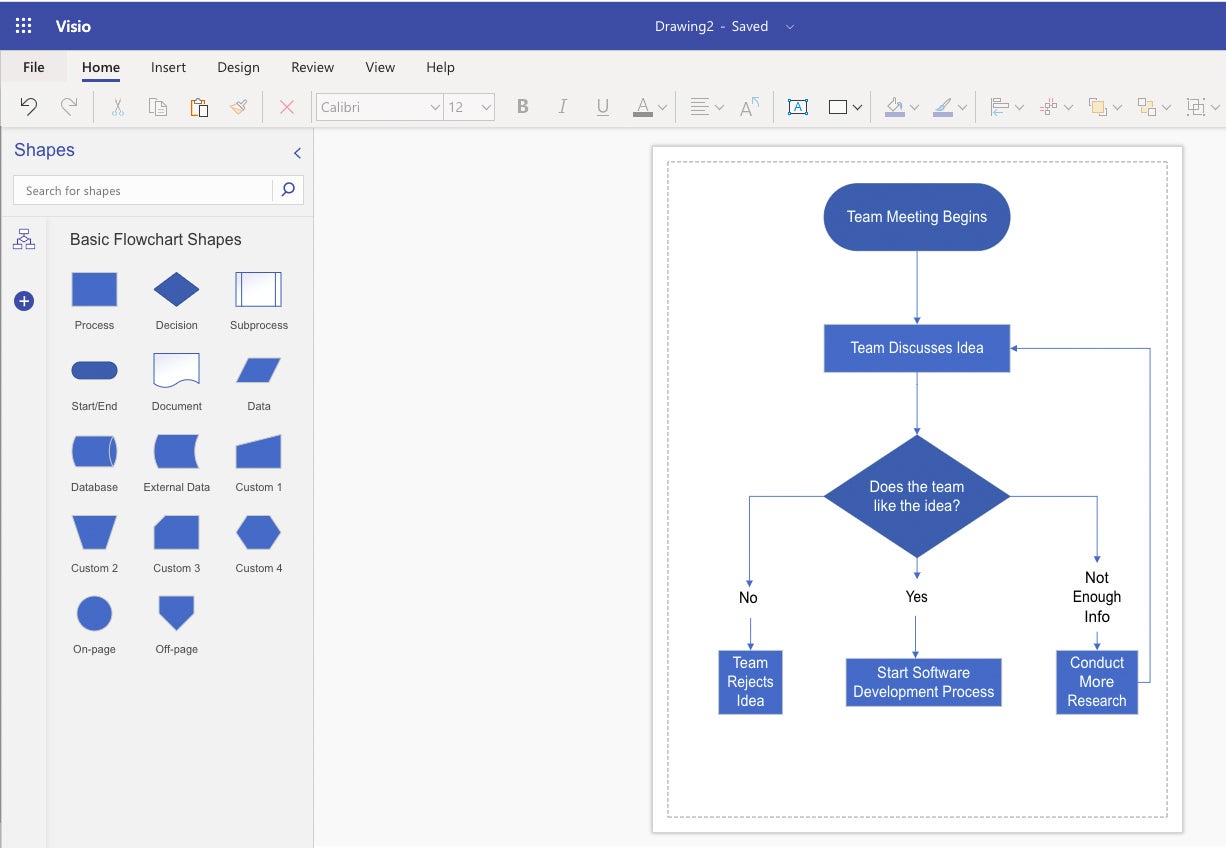 Shimon Brathwaite/IDG
Adding and connecting the three outcomes. (Click image to enlarge it.)
Now we’ve added three possible outcomes to our decision tree that will cover the possible outcomes of the meeting. Please take note of the third decision (furthest to the right). Often you may need to account for decisions that will result in you going back to an earlier step in the process and redoing some steps. (Having the third option return to a previous step in this example is for demonstration purposes; in reality, you’d conduct more research outside the meeting and then discuss the idea again in a later meeting.)
Now there is only one step left: add the ending to the flowchart (using the Start/End shape again), which is when the meeting ends.
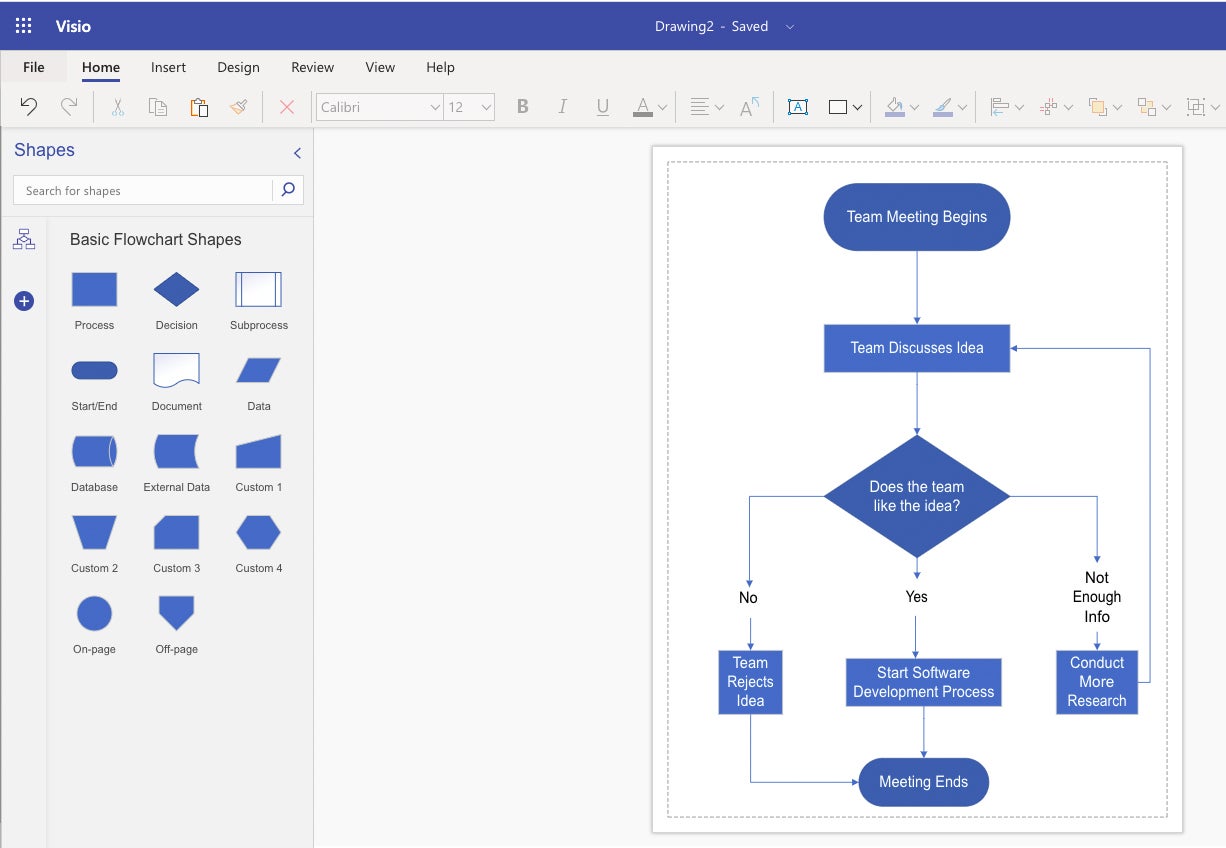 Shimon Brathwaite/IDG
Add, label, and connect the end shape, and the flowchart is complete. (Click image to enlarge it.)
How to create an organization chart in Microsoft Visio
Next, we will look at how to create a simple org chart that consists of one head executive, their assistant, two managers, and their corresponding teams. Go back to the Visio start page and click on the Organization Chart template.
Creating an org chart is relatively simple. As we did with the flowchart, drag and drop the items you want — in this case, colored rectangles corresponding to work roles — from the left pane onto the main canvas and organize them in a hierarchical structure as shown below.
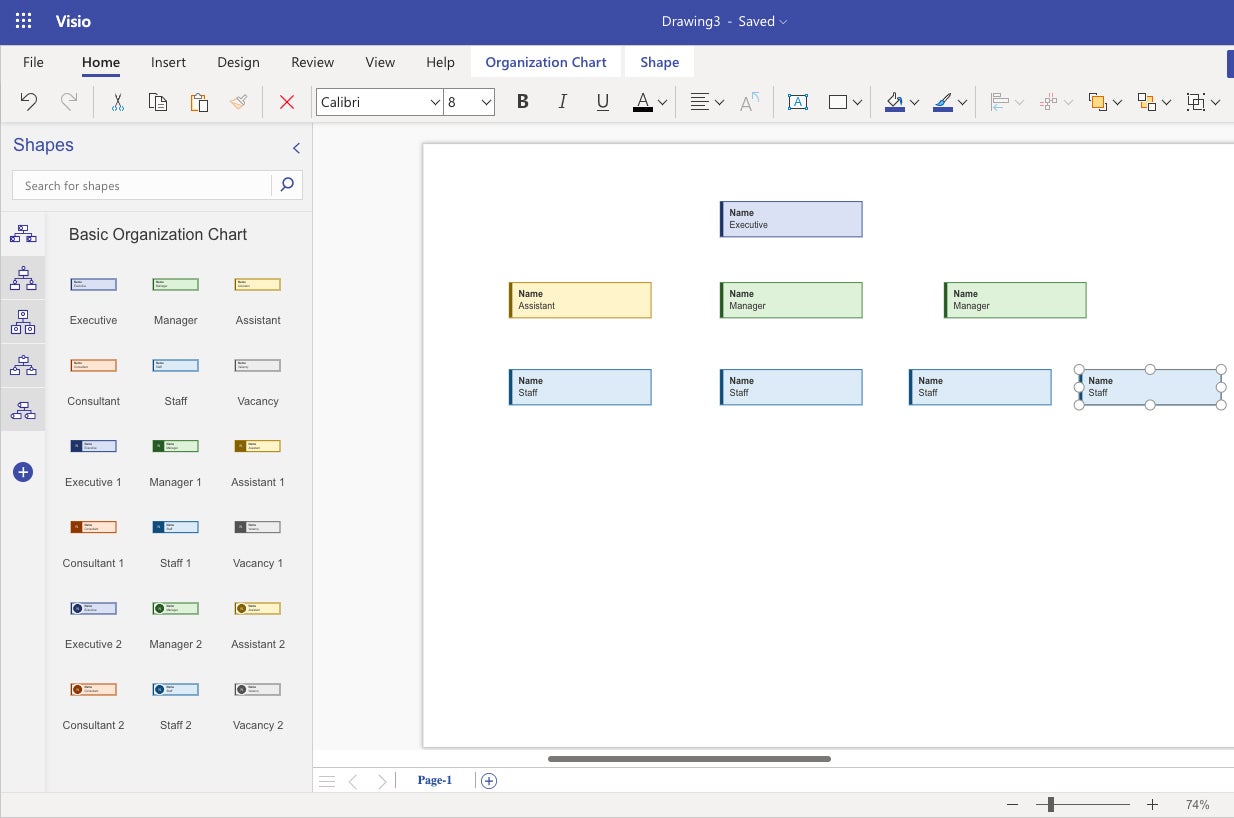 Shimon Brathwaite/IDG
Drag and drop placeholders for the employees in your org chart. (Click image to enlarge it.)
All that’s needed after that is to draw the lines showing the relationships between staff members. As with the flowchart, draw lines going from the higher-level staff to the lower-level staff.
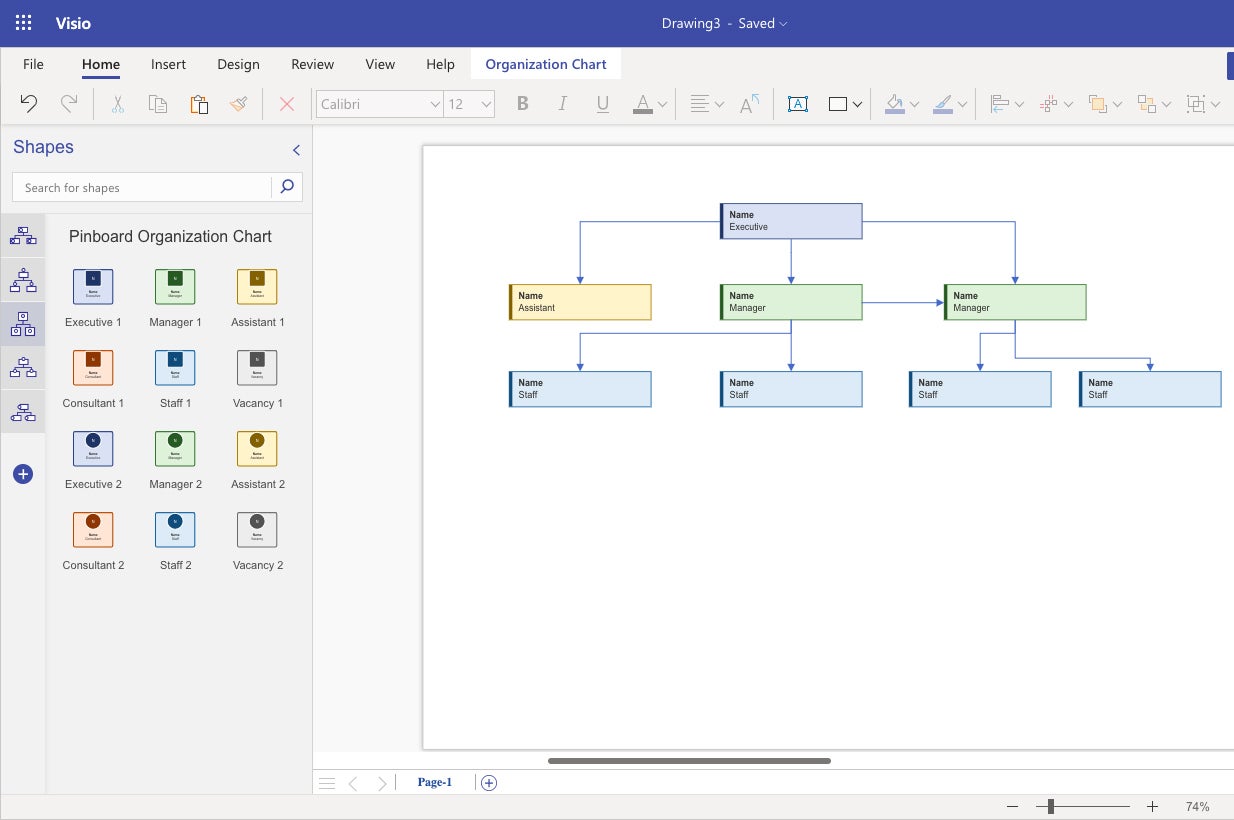 Shimon Brathwaite/IDG
Draw connector lines showing the relationship of employees to one another. (Click image to enlarge it.)
To add text to the boxes, click on each image, then modify the name and title of the staff member.
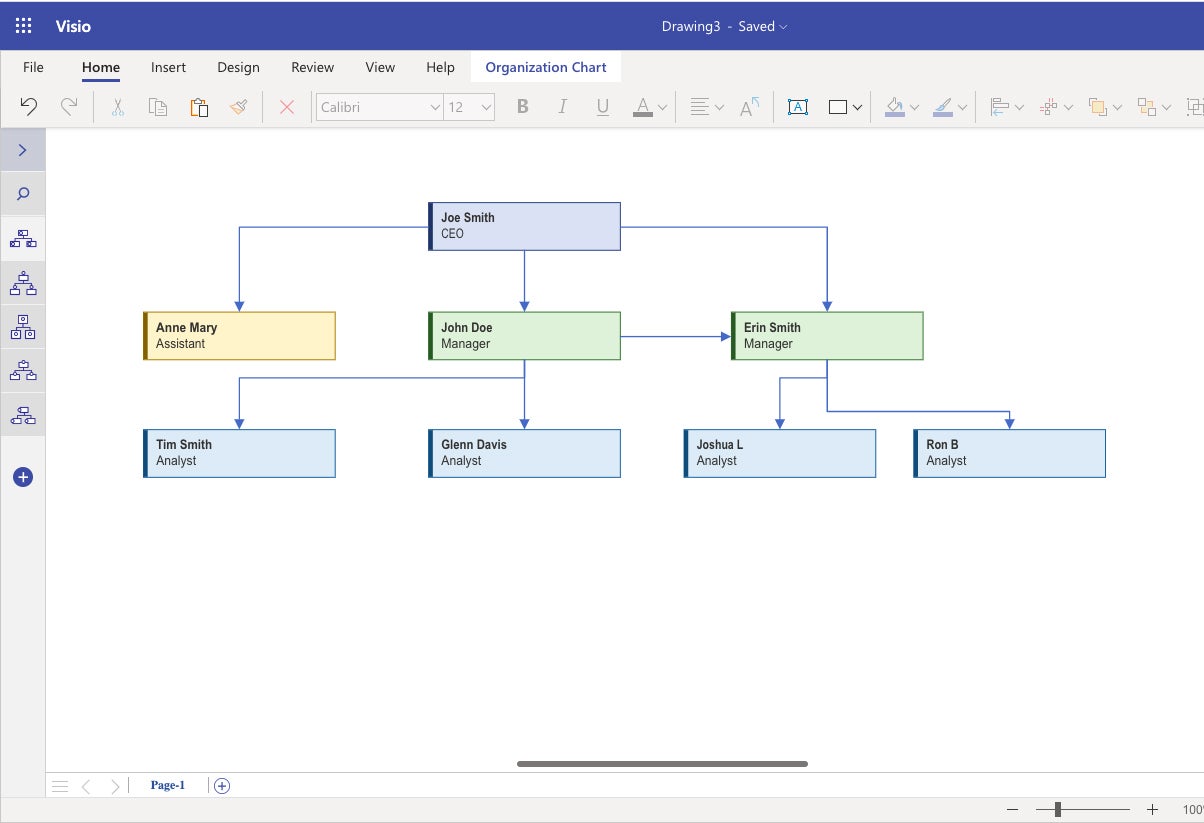 Shimon Brathwaite/IDG
Fill in the employees’ names to complete the org chart. (Click image to enlarge it.)
How to create a diagram from scratch in Microsoft Visio
If there are no templates that suit your exact needs, you will need to create a diagram from scratch. While we cannot anticipate every action you may want to take in creating a custom diagram, here are the basic steps for creating a custom diagram.
To begin, from the Visio start page click New blank drawing.
1. Select and place your shapes.
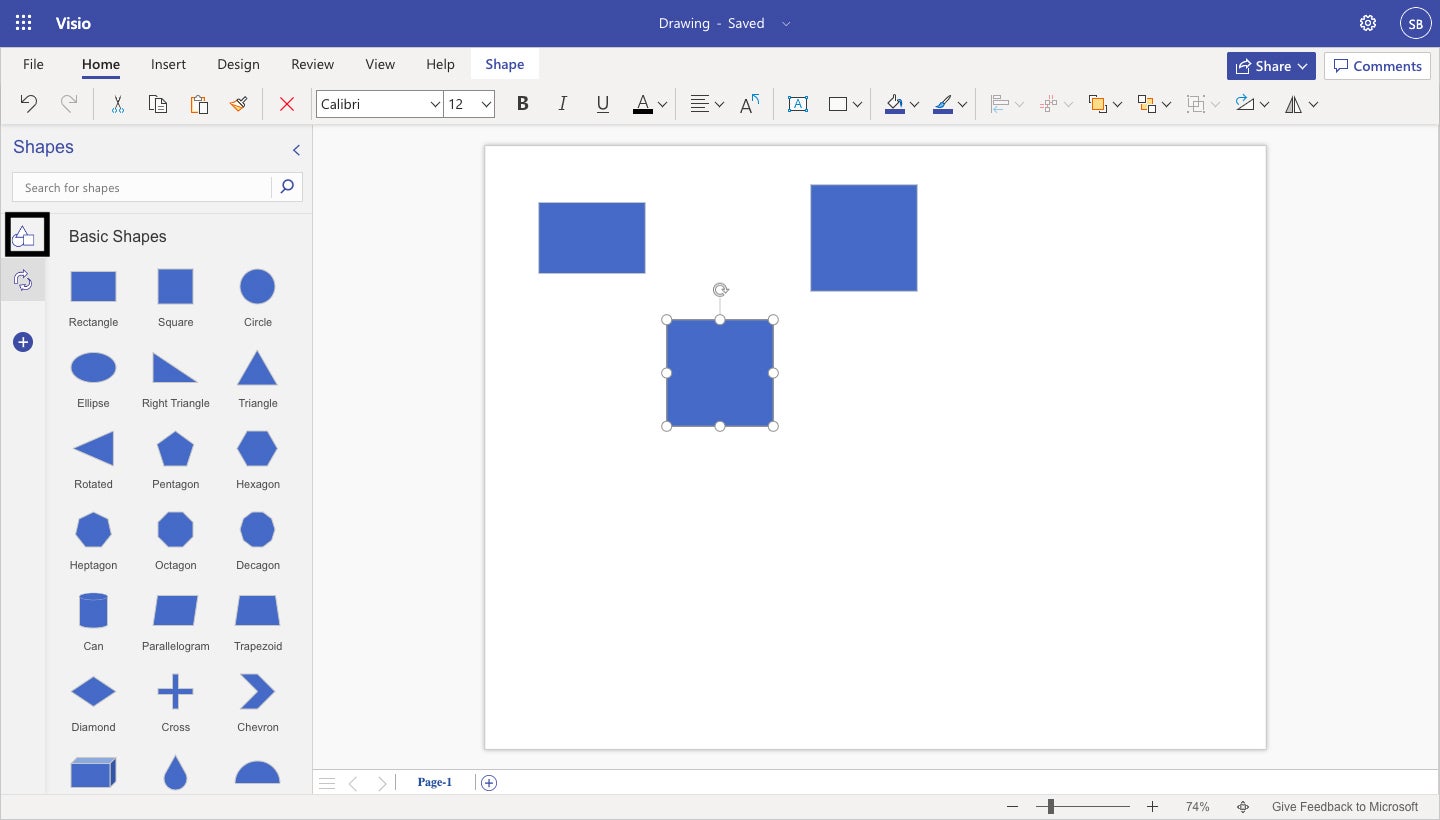
As when using a template, you’ll see the Shapes panel on the left side of the screen, with a blank canvas to the right. The basic building blocks of your diagram will be different shapes that you use to represent different items. Simply click and drag your desired shape(s) onto the canvas.
 Shimon Brathwaite/IDG
Drag any shapes you want to use for a diagram from the shapes panel onto the canvas. (Click image to enlarge it.)
You can move, resize, and add text to shapes on the canvas just as we did when using a template.
In addition to the generic shapes that appear in the Shapes pane by default, you can look up custom icons that more accurately describe the information that you want to convey. Click the plus symbol at the left of the panel, and you’ll be able to browse through multiple collections of shapes and icons that you can pin to your panel, such as Cycle Diagram Shapes, Business Frameworks, and Interface Icons. (In fact, Visio templates are basically targeted sets of these shape collections.)
You can also use the search box at the top of the Shapes panel to search for specific icons, as shown below.
Use the search box to find highly specific shapes or icons for your diagram. (Click image to enlarge it.)
2. Add arrows
Next, you need to use arrows as connectors to show relationships between the shapes in your diagram. These arrow images help people to understand the logical direction that information is flowing. For example, in an org chart, you need to show people who report to those within the organization. Click the icon with two curved arrows at the left of the Shapes panel to see the Arrow Shapes collection.
Visio offers an array of arrow types you can use to show the progression of your diagram. (Click image to enlarge it.)
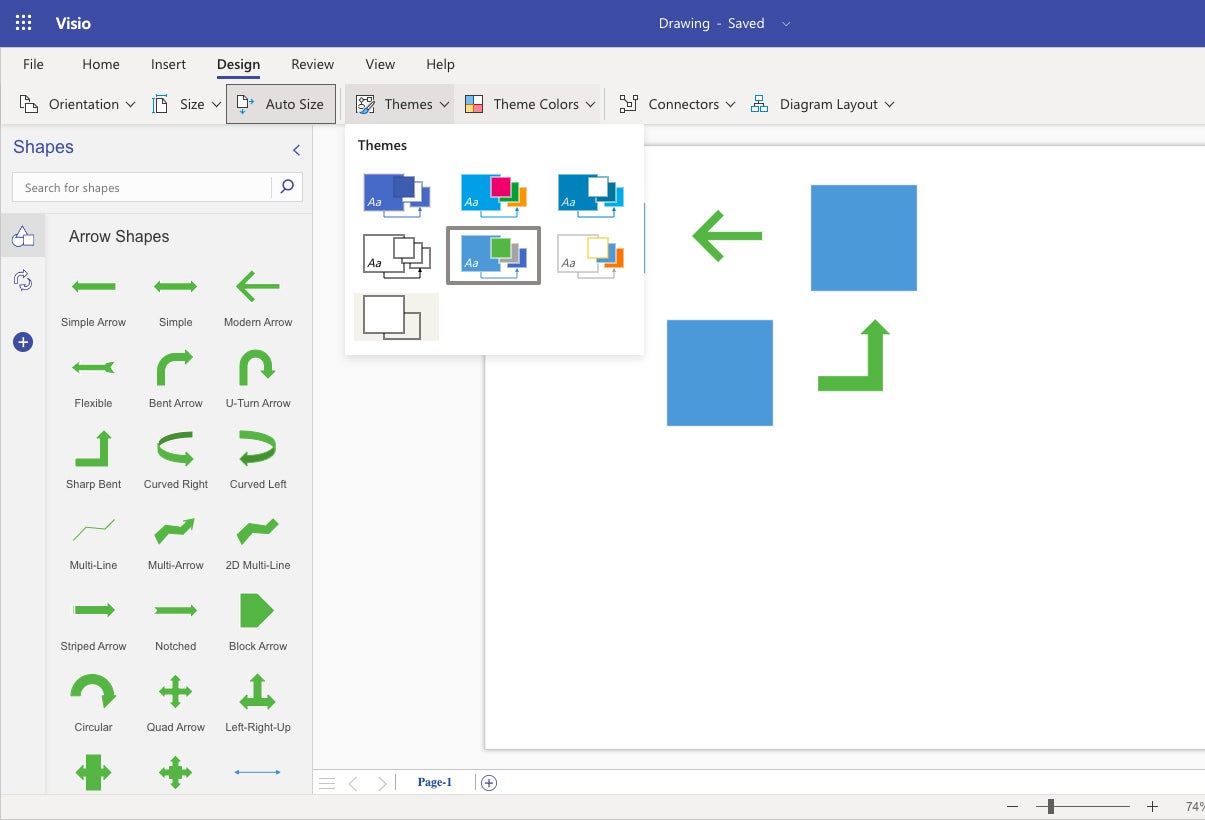
3. Apply a theme
Themes can be helpful to make your diagrams more visually appealing or to reflect company or client color schemes. To select a theme, simply go to the Design tab in the Ribbon, click Themes, and select the theme of your choice.
 Shimon Brathwaite/IDG
Applying a theme makes your diagram more attractive and easier to take in quickly. (Click image to enlarge it.)
How to save, open, and collaborate on Visio diagrams
As you’re working on a diagram in your browser, Visio autosaves your work, calling it “Drawing” (or “Drawing2,” “Drawing3,” etc.) by default. To change its file name to something more meaningful, click its name in the title bar at the top of the screen and type in a new name.
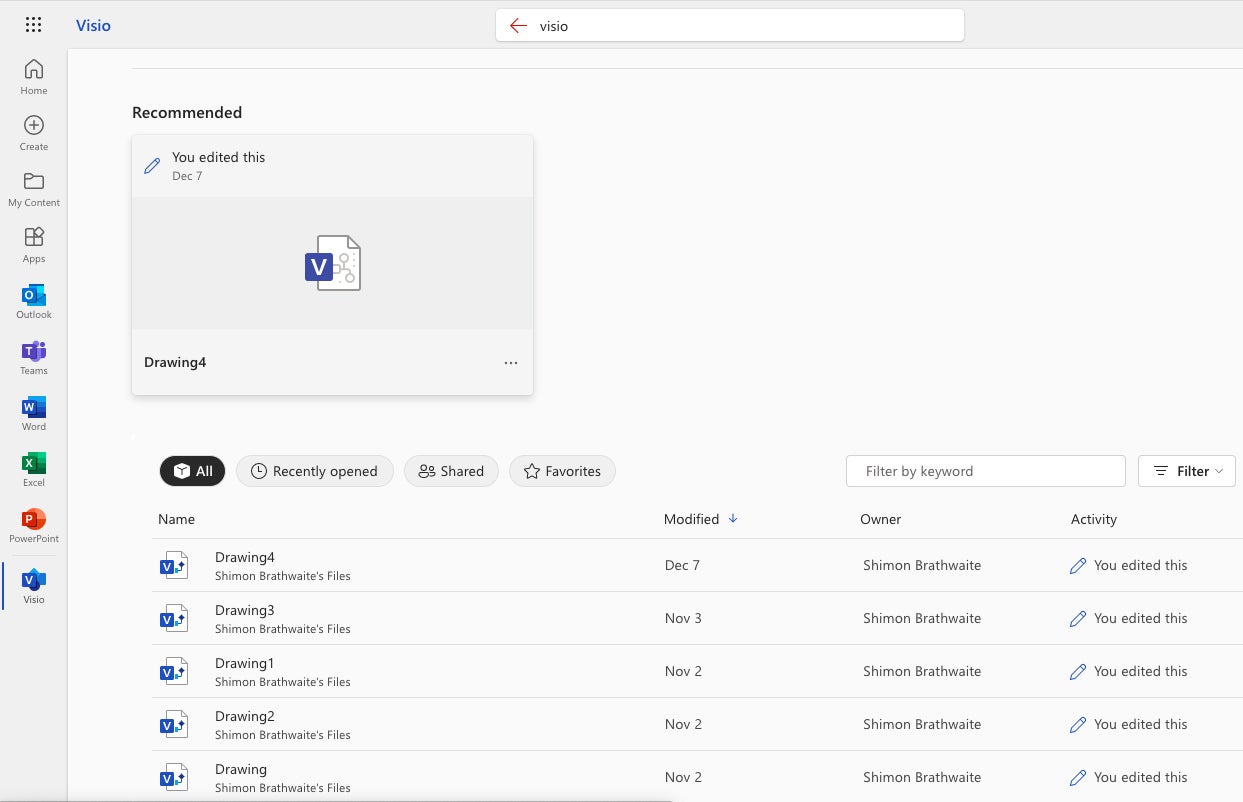
When you go back to the Visio start page, you’ll see all the diagrams you’ve created (and that others have shared with you) in a list at the bottom of the page. Click any file name in the list to open the diagram.
 Shimon Brathwaite/IDG
Visio files you have access to are listed on the Visio start page. (Click image to enlarge it.)
The diagram will open in a mode that lets you view and comment on it, but not edit it. To switch to editing mode, select Edit Diagram > Edit in Browser at the top right of the screen.
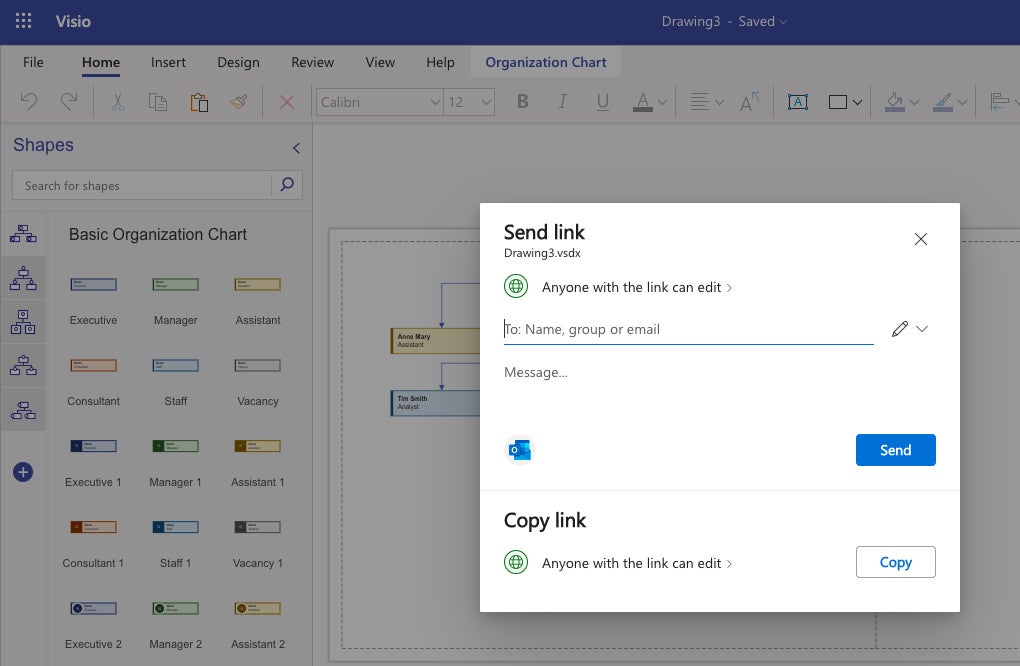
Like Word, PowerPoint, and other Microsoft 365 apps, Visio lets you collaborate on diagrams with co-workers in real time. Microsoft calls this “co-authoring.” To share a diagram, click the Share button at top right and select Share from the menu that appears. The “Send link” pane appears. Here you can type in colleagues’ names or email addresses and an optional message. Click the pencil icon at the right to choose whether you want to let the people you’re inviting edit the diagram itself or simply view and comment on it. When you’re done, click Send, and your invitees will receive an email with a link where they can access the diagram.
 Shimon Brathwaite/IDG
You can invite colleagues to collaborate on a Visio diagram. (Click image to enlarge it.)
To add a comment to a diagram, click the Comments button at the top right and then click New in the pane that appears. To comment on a specific item in the diagram, click its shape and then click the New button in the Comments pane. Type your comment in the comment box (you can @mention someone to call their attention to it) and then click the Post comment button (a paper airplane icon). Others can read and reply to your comments and/or add their own comments.
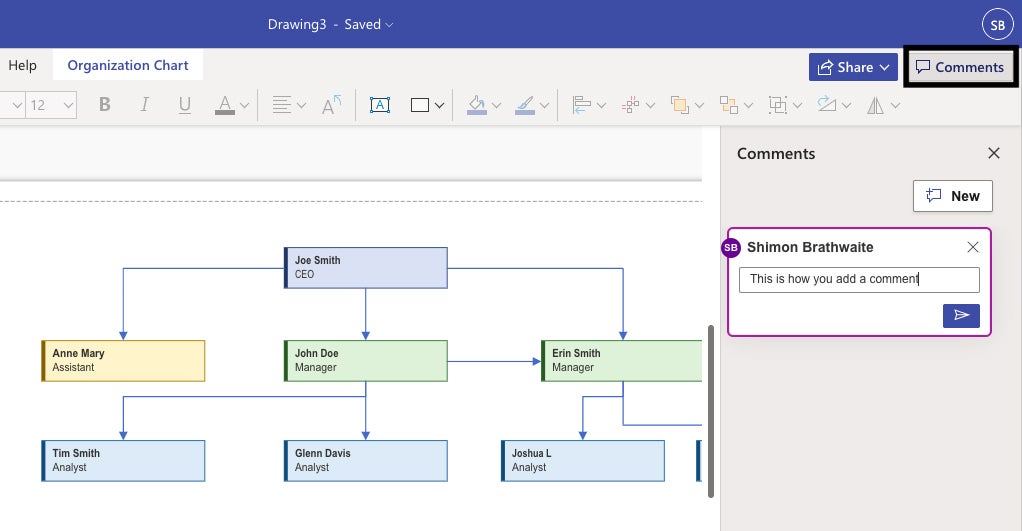 Shimon Brathwaite/IDG
Adding a comment to a diagram. (Click image to enlarge it.)